

Hello everyone!
The Daily Trends feature in EverBee Research helps you quickly understand how a product or niche is performing over time, and what you see depends on which plan you’re on.
What Daily Trends Show
Daily Trends visualizes how key metrics (like sales and revenue estimates) move day by day so you can spot momentum, seasonality, or drops in interest.
For e-commerce sellers and creators, this makes it easier to decide what to double down on and what to phase out instead of guessing based on “feel.”
Daily Trends on Growth Plan
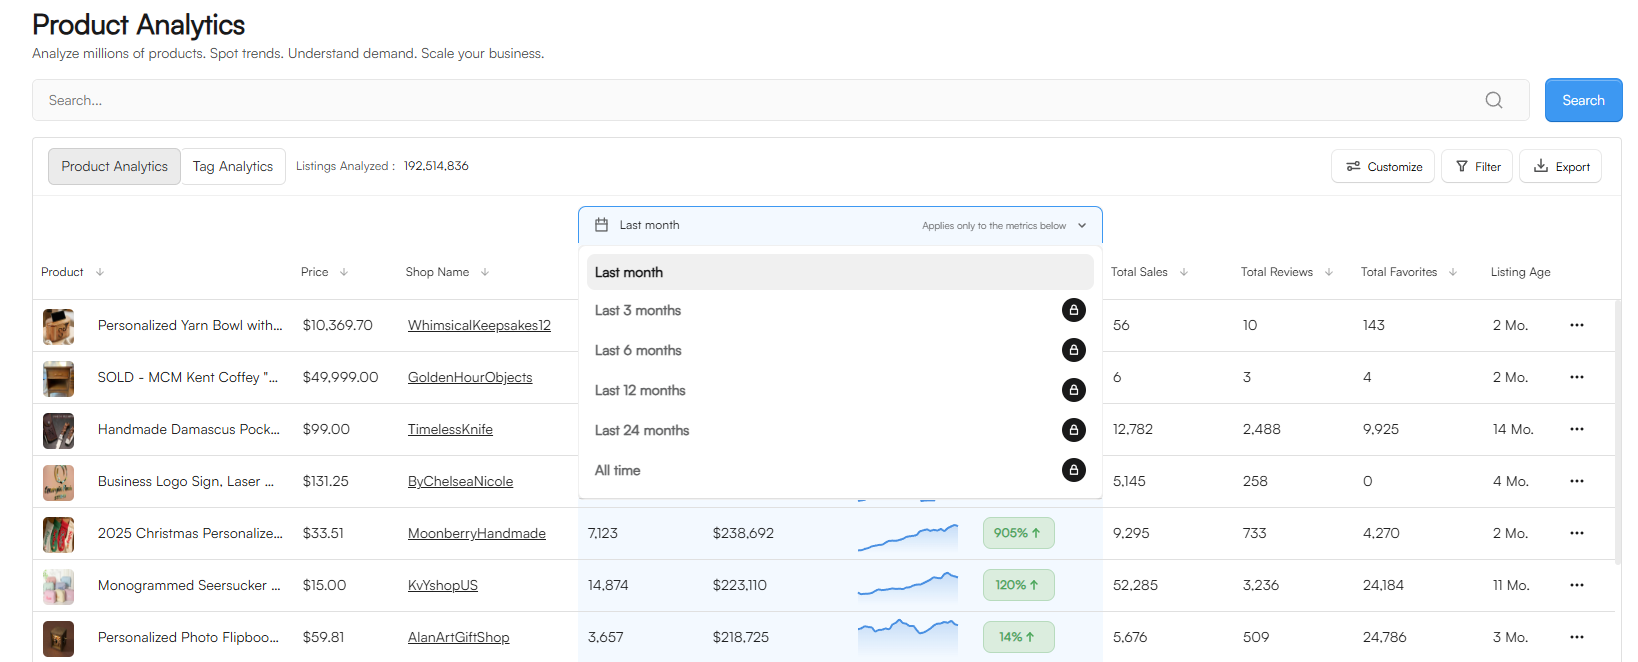
On the Growth plan, Daily Trends shows data from only the last 30 days. This 30‑day window is great if you mainly care about recent performance, such as testing a new product, running a promo, or validating a fresh niche before investing more.
Track how a listing reacts right after you launch or edit it (price, photos, SEO) and monitor the impact of a recent campaign (for example, you run ads for 2 weeks and watch the trend line inside that 30‑day period). Quickly compare which of your “recent bets” are gaining traction vs. stalling.
You can also check all-time information for a single listing if you open it and click on the daily trends graph or select a time period.
Daily Trends on Business Plan
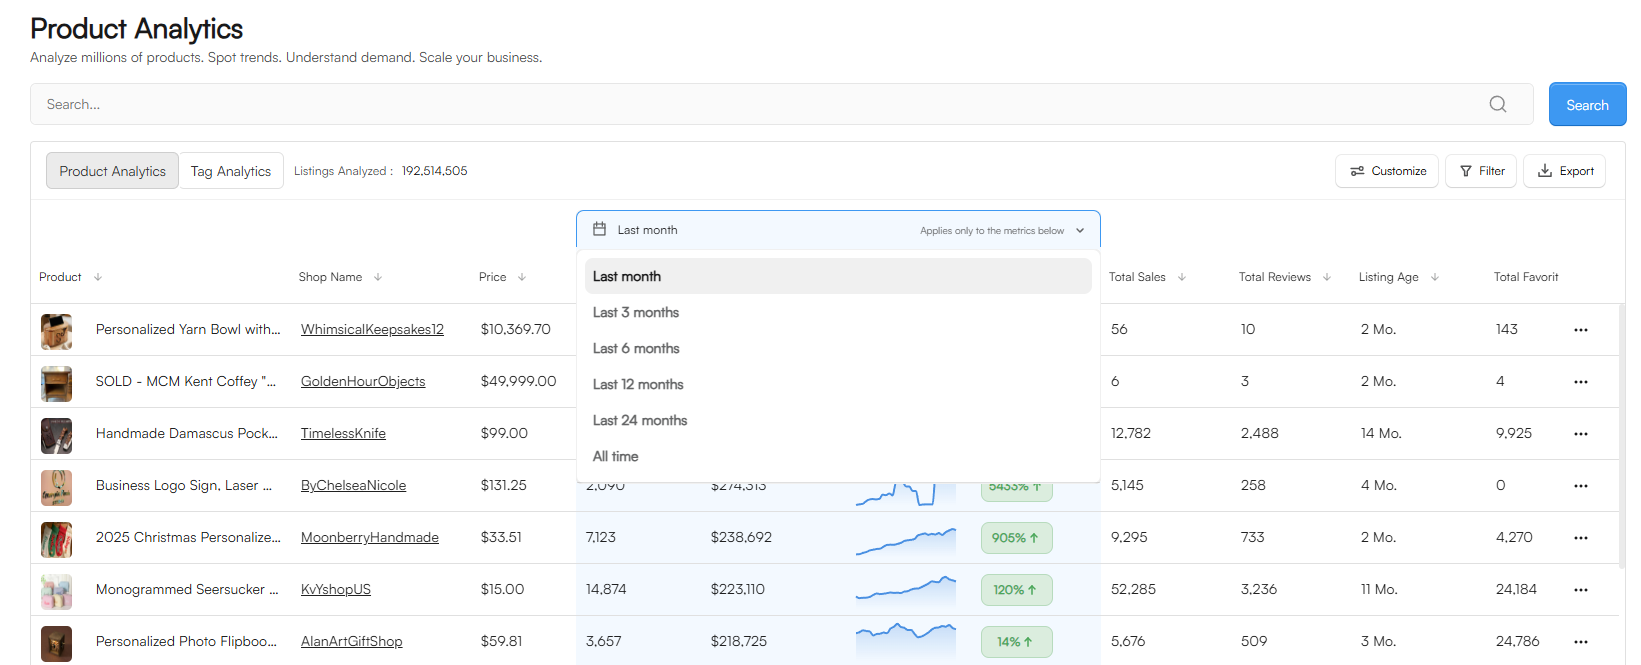
On the Business plan, Daily Trends can show data up to all‑time for that listing or keyword, not just the last month for the table-view. This longer history is especially useful if you’re running a bigger shop or brand and need to understand patterns over seasons, holidays, or multiple years.
Check if a product is truly evergreen or only spikes during specific seasons, and look at long‑term performance before scaling with bigger ad budgets or inventory. Spot older products that are quietly consistent and might deserve more promotion.
If you have any further questions, please reach out at hello@everbee.io.