

The Daily Trends dashboard in the Product Analytics table gives you a view of sales and overall performance, product by product.
Whether you’re monitoring a major launch or just looking for subtle signs of change, this dashboard delivers high-frequency insights you can act on fast.
What’s New in the Product Analytics Table?
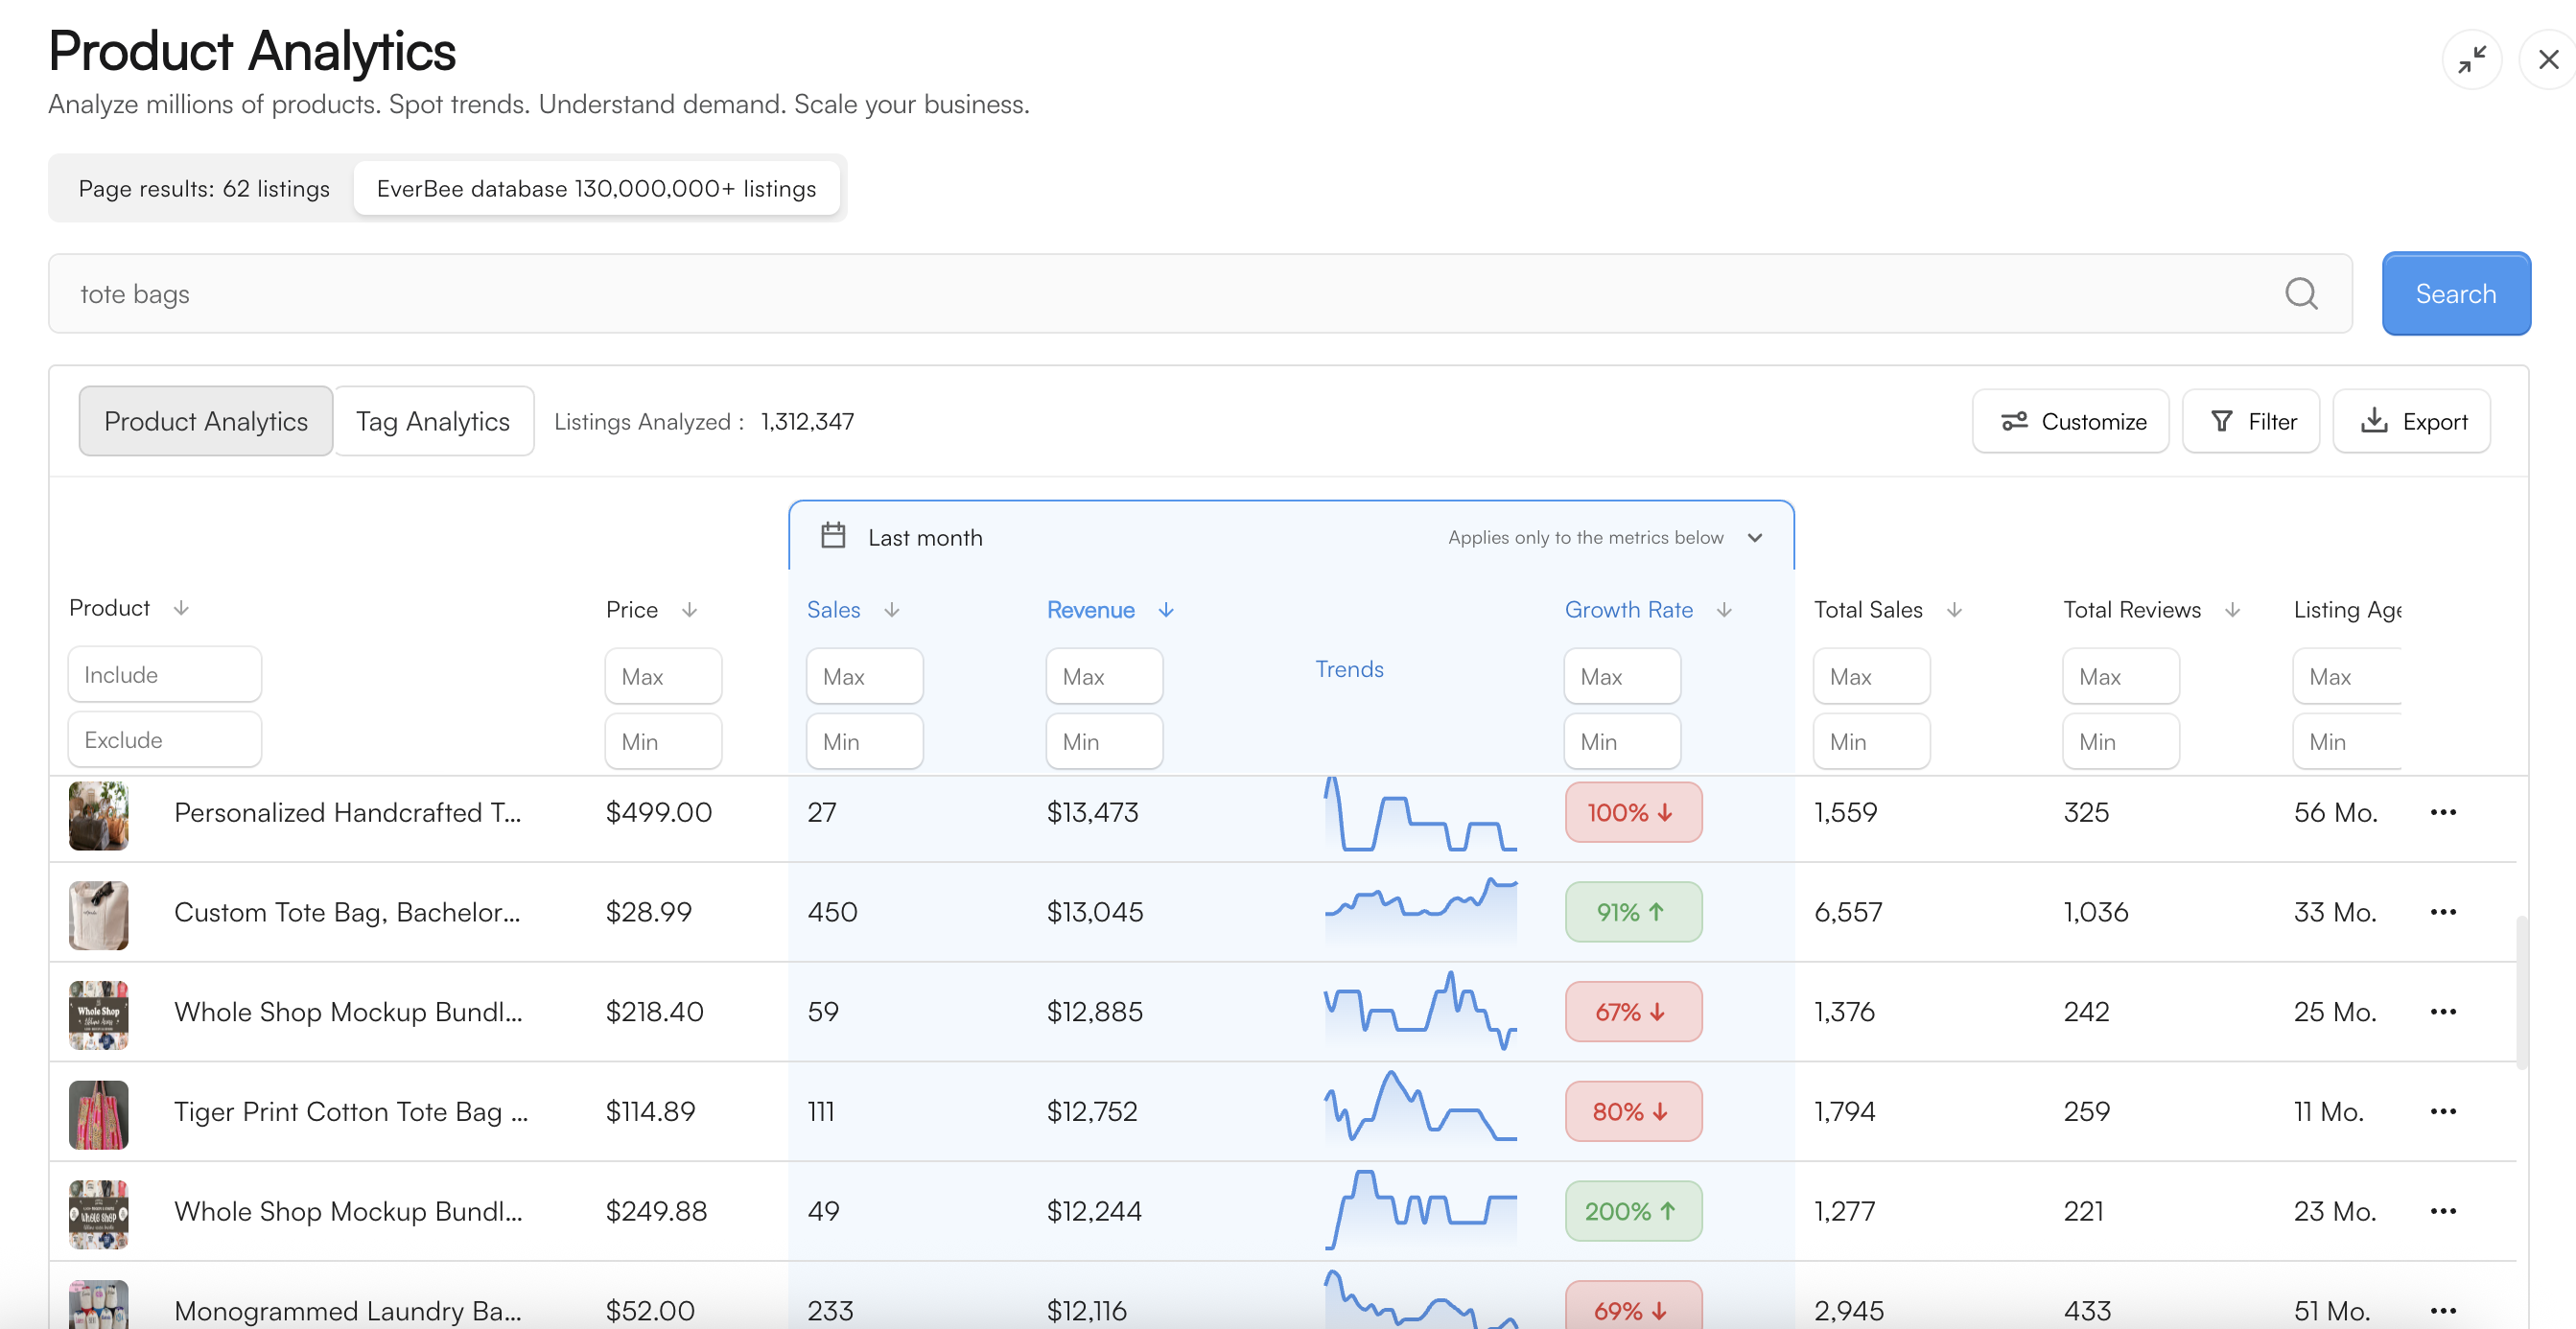
We’ve added a Date Range Selector right above the key metrics in your research table: Sales, Revenue, Trends, and Growth Rate.
This lets you narrow down your view to focus on performance over specific timeframes.
This upgrade makes it easier to:
View short- or long-term performance
Compare different periods
Uncover meaningful shifts faster
Daily Trends at Table Level
Now, you don’t need to dig into individual listings to see daily performance. You can track daily sales trends, growth rate, and revenue directly at the table level.
Perfect for answering:
What’s trending today?
Which products are growing quickly?
Are sales slowing or picking up this month?
Access by Plan
🔹 Growth Plan
See daily trends for the last month right in your table
Access full trend history from Last Month to All Time on individual listings
Table-level filters apply only to the last month
🔷 Business Plan
Unlock up to 24 months of historical trend data in your table
Filter by 1, 3, 6, 12, or 24 months
Spot seasonality, year-over-year growth, and long-term winners
Access full daily metrics: revenue, growth rate, and total sales
🔍 Feature Highlights
Sort by Growth Rate to quickly identify fast-moving products
Apply custom filters to dig deeper into patterns and insights
Use table-level insights to make faster, smarter product decisions
This update gives you more control and visibility, all from one place. Start using Daily Trends and the new Date Range Selector today to stay ahead of what’s trending and growing.
Your product research just leveled up.